
Adding context is probably the most important thing when analyzing data, when you really want to draw useful conclusions. I show you how to do that with any data, with the social accounts of eBay Deutschland as an example.
(I don’t work with eBay Deutschland or personally know someone working there. I just picked this as an example because I gave a presentation at a barcamp, where people from eBay Deutschland attended as well.)
The life of a communicator
Let’s get my view on things clear, right from the beginning: Every communicator should be able to classify and interpret owned data.
Five thousand Instagram impressions is just a number, when you don’t know what you are measuring against. Is this a high number in comparison to other Instagram posts on your account, with the same topic and goal?
You need to be aware of this context, so you won’t post blindly on all channels, but can make better decisions supported by numbers. Which topic works best on which channel, with which media type (text, picture, video,…)?
And of course the goal is important. Do you want to have engagement on the channel itself, or lead users from the channel to a landing page, where they should fill out a form? I’m sure you agree when I say this is a huge difference, when it comes to deciding if a post was successful.
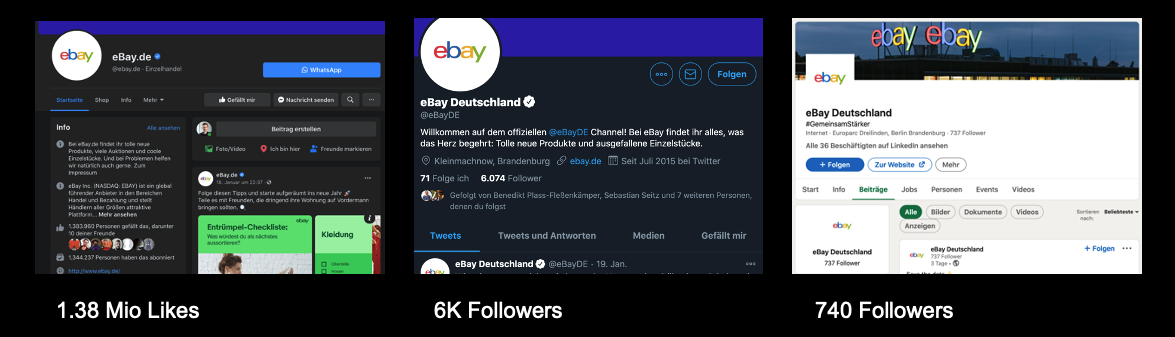
In our example, I looked at each of the last five posts of eBay Deutschland’s Twitter, LinkedIn and Facebook channel. As I don’t have access to their back-end, I just noted Engagement as a post KPI (Key Performance Indicator).
Start asking more questions
First of all, start asking more questions! Because as a comms manager, you are the expert in your topics and channels. Ask yourself, which content types, goals and topics you have on your channels.
In our eBay Deutschland example, I marked the content with the following goals:
- Reach, which is all about making people aware of your topics
- Engagement, which focusses on things like comments or likes on a platform
- Call to action, which has the goal of leading users from a channel to a landing page, or making them fill out a form or download a white paper
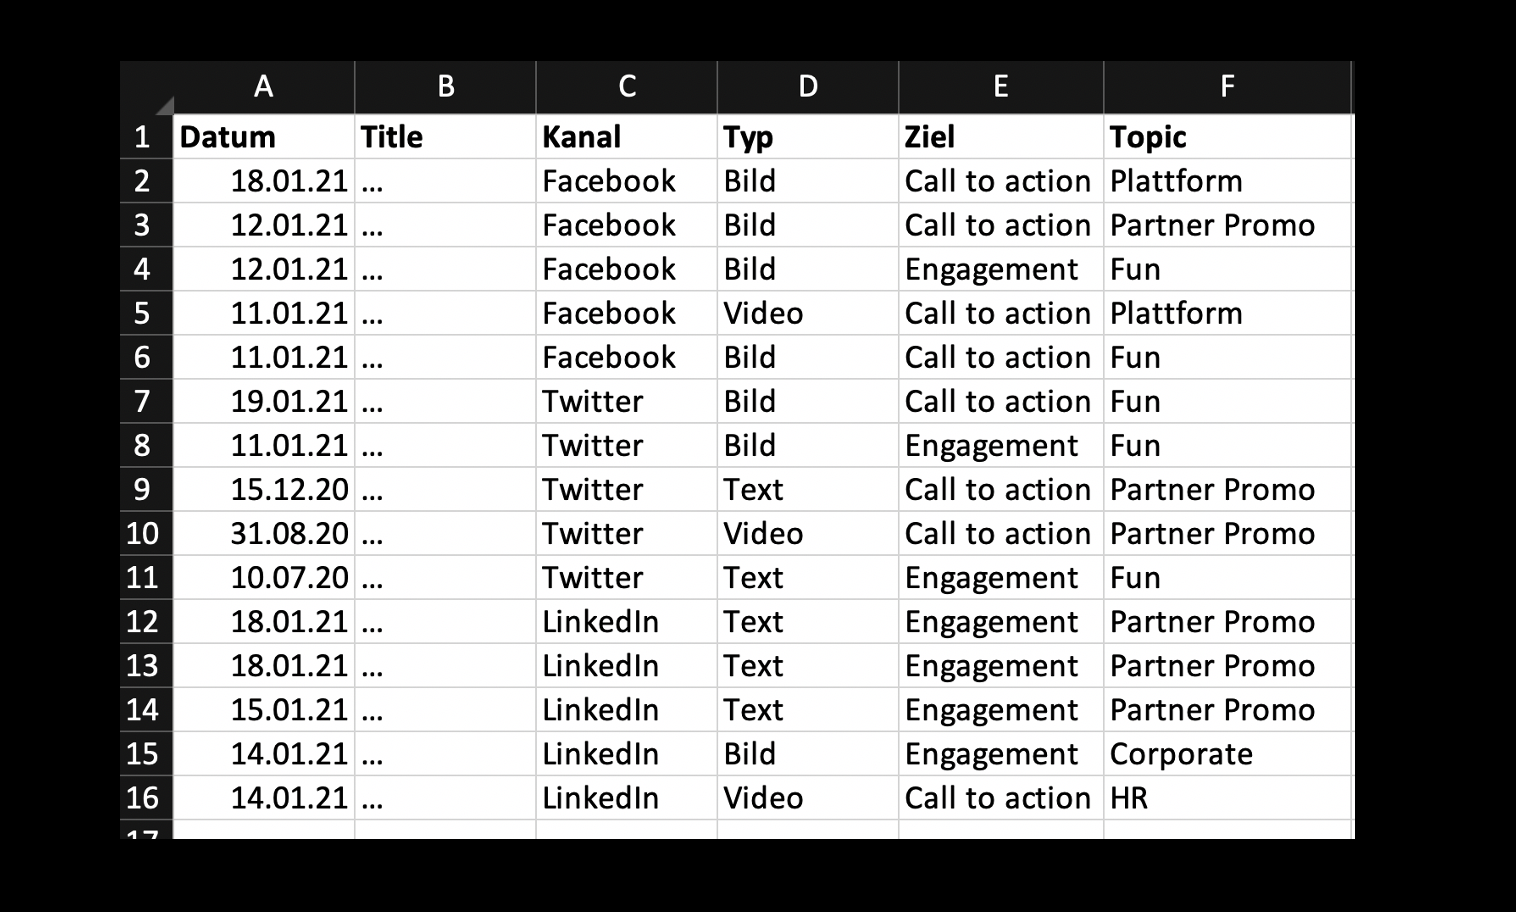
Start classifying your existing and planned content by filling that information into your content management system, content planning tool or even in a simple Excel table. As you can see in the screenshot, I had a column with dates, titles, channels, types, goals and topics.
Matching meta data with KPIs
Now you have basically two tables, that could be simple Excel files or more complex data bases:
- The KPI export from your content on a channel, for example a report exported from Twitter
- The table with meta data, classifying your content
The logic which adding context is based on, is finding matching columns in two different data tables.

For example, when you export data from your Twitter analytics, you get a Post URL column. From some tools you even get a Post ID column. This URL or ID column can be matched with another table that also has this Post ID/URL column.
Means you add exactly a column like this to your meta data table, if you haven’t yet. Then with a data visualization tool like Power BI, you can import both tables and define the connection based on that matching column.
From now on, you only need to update your KPI table, coming from the publishing platform. By manually downloading a new table report, or by a constant data connection.
Gaining new insights
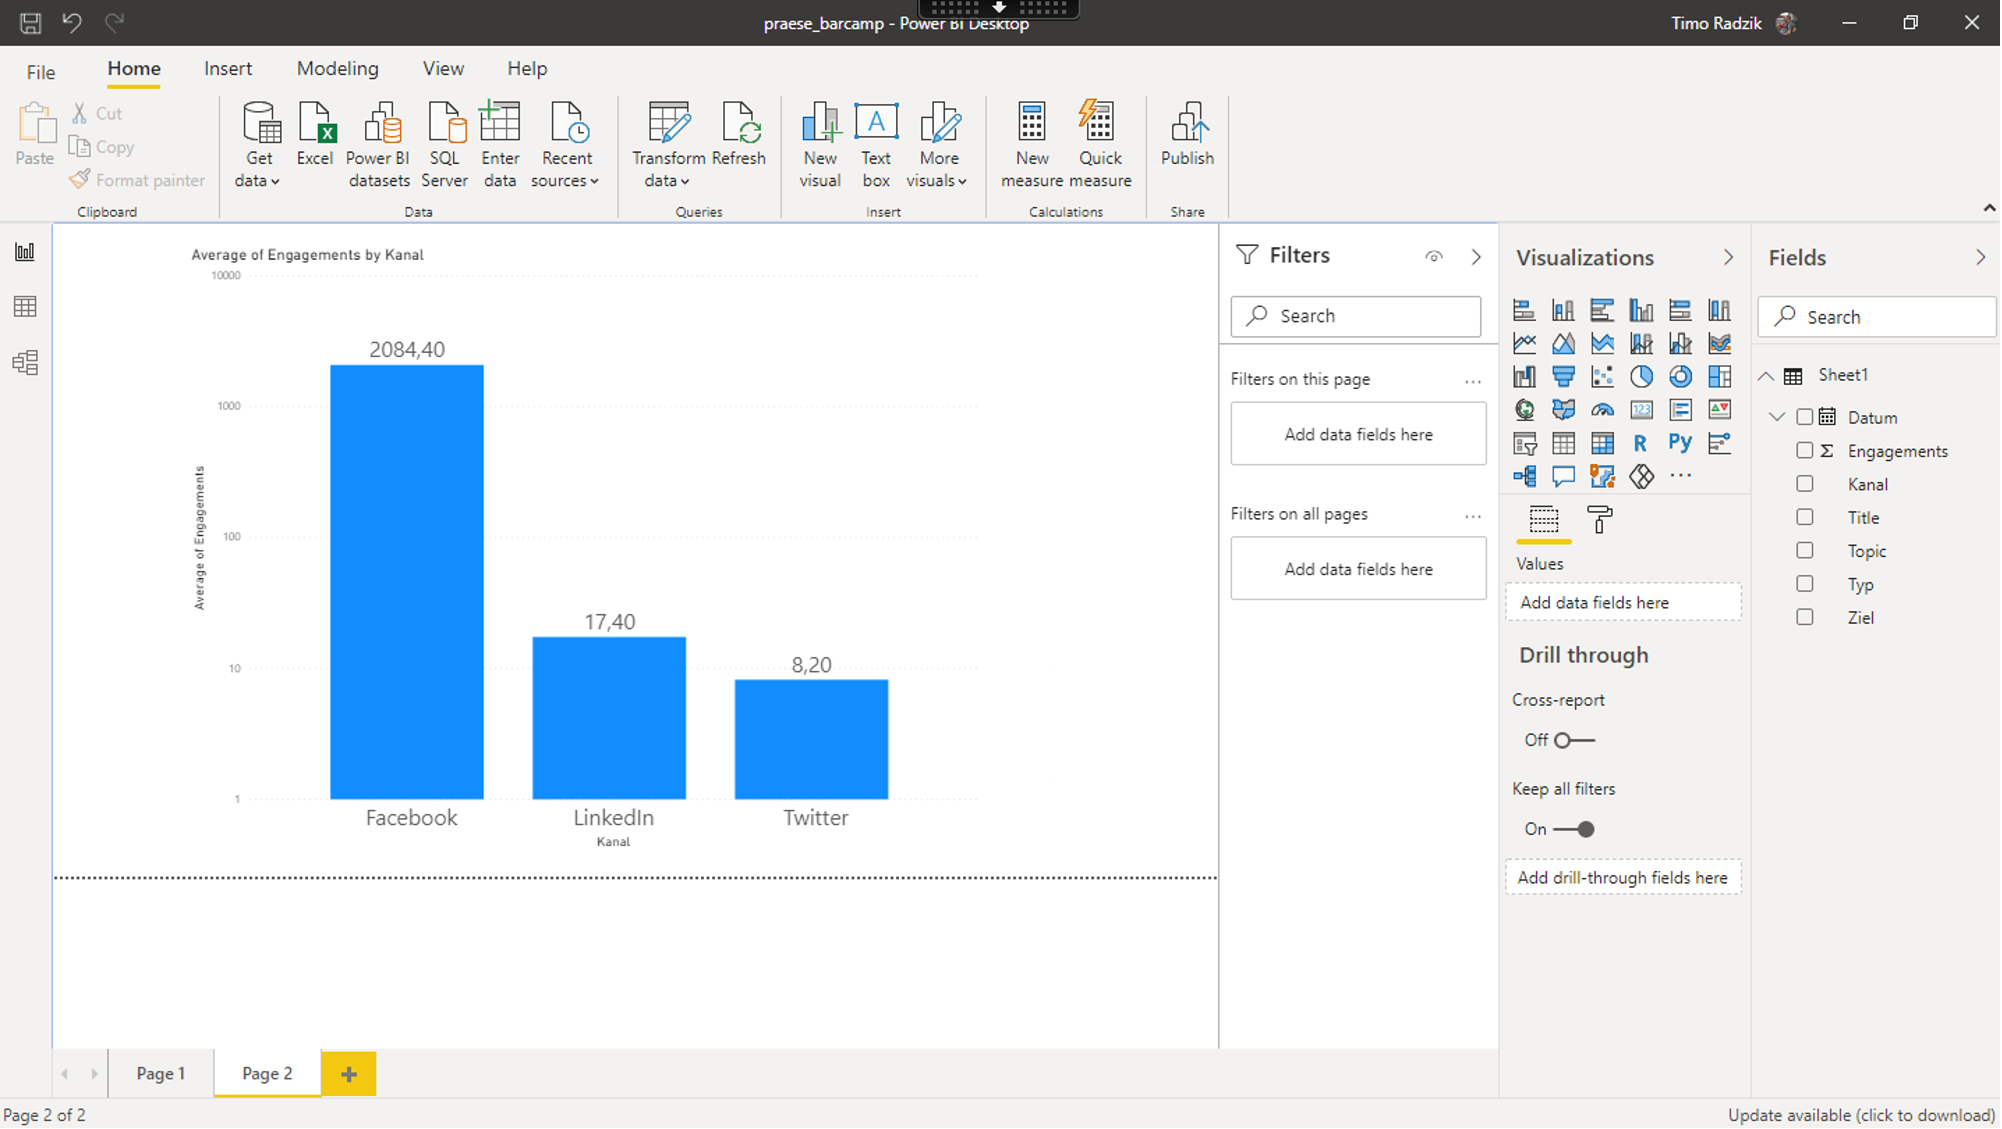
In the screenshot you see how I imported everyhting into Power BI and then started dragging the channel-column and engagement-column into the workspace.

Without context, Facebook posts are performing way better on average than posts on LinkedIn or Twitter. I mean wayyy better.
But let’s add more context here and look at it relatively to the channel. In the following screenshots you can see what you could do with the additional context: Look at the performances based on media types, goals and topics including example conclusions as quotes:
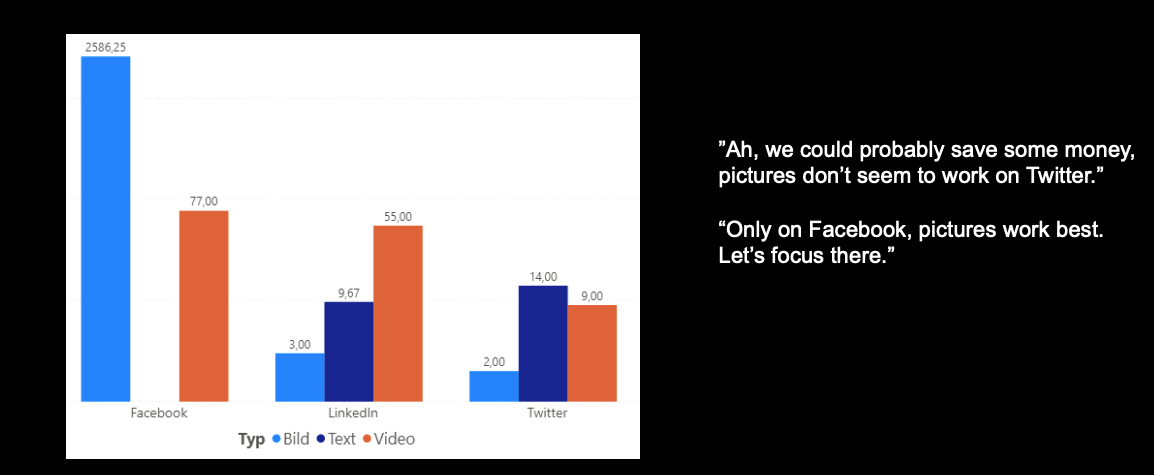
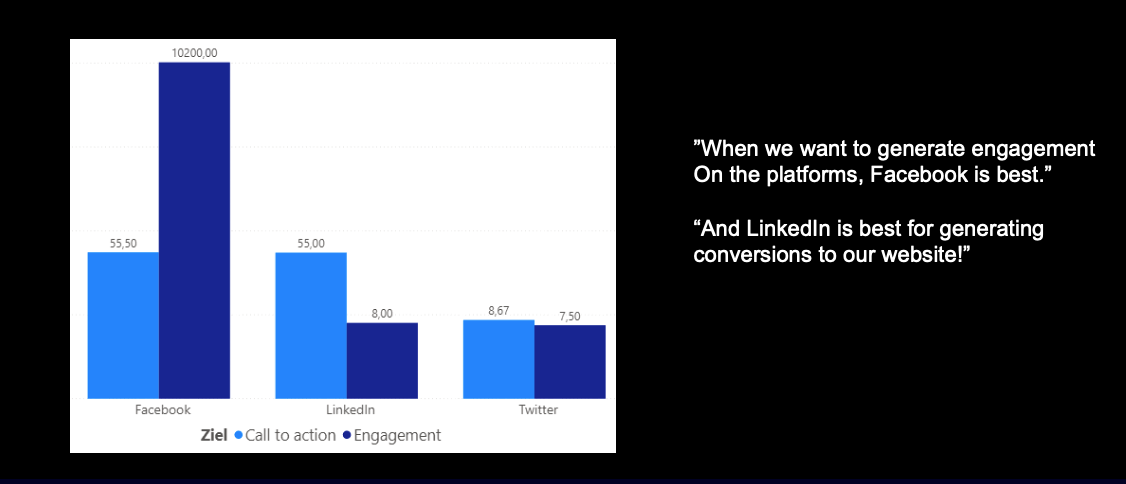

And suddenly you can make better decisions about which topic fits which channel best. Where you probably don’t need certain media types and which channel works best when you want to lead users to your website.
Do you also use this logic to analyze your data? Leave your feedback in the comments below or reach out to me if you have questions!
 wpDiscuz
[…] How to give data more context (eBay Deutschland example) […]
Pretty cool – so you would abondon pretty expensive reporting tools (at least the reporting part) like Sprinklr, right?
The ranking FB, LI, TW looks familiar to ours, but reliable topic classification may still be improved among publishers 😅
Thanks for your questions Anna-Lena, that I totally missed, shame on me!
I wouldn’t say that expensive reporting tools can be abandoned. The benefit there is that it’s probably better visualized and that there is already an automatic data refresh. So daily reports are much easier to do there than refreshing an excel table by hand :D
But when it’s just about a monthly performance overview or about calculating benchmarks, excel can be enough.
Your article helped me a lot, is there any more related content? Thanks!